![]()
God’s Word does not contain any charts (sometimes, we wish that it did); but the reality is that charts cannot convey the depths of God’s Word. However, they can sometimes help us better understand the ‘big picture.’ We pray these charts (PDF files read by Adobe Reader) will aid in your study of the Scriptures. Click on a chart name to open in a PDF reader.
![]()
Acts – Book of Transitions
This chart depicts the transitional nature of the book of Acts, showing the changes in God’s eternal purpose as He moved from offering the kingdom to Israel to opening up salvation to the Gentiles and laying the foundation for the Church, the Body of Christ.
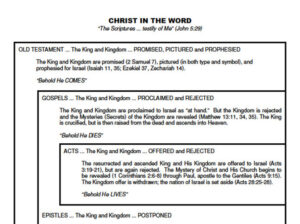
Christ in the Word
This chart shows how Christ is the subject of all Scripture. It depicts how He is presented from the Old Testament through the Revelation. The idea for this chart was borrowed from How to Enjoy the Bible by E.W. Bullinger.
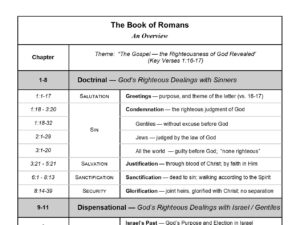
Outline of Romans
This chart provides an outline for the book of Romans, a vital book by the Apostle Paul which covers many fundamental doctrines of the faith: righteousness, sin, salvation, justification, sanctification, security, law vs. grace, works vs. faith, etc., as well as providing instructions for righteous living.
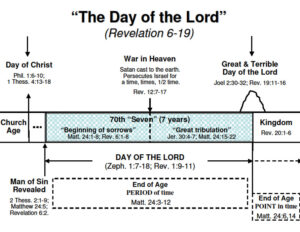
The Day of the Lord
This chart depicts the future “Day of the Lord,” a period of time during which God will pour out His judgment and wrath upon the earth. This “Day” will culminate with the Second Coming of Christ.
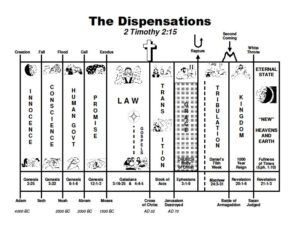
The Dispensations
This chart gives a basic dispensational overview of God’s plan for the ages. It contains clipart pictures to help make it more appealing to children as well as adults.
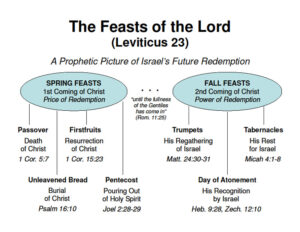
The Feasts of the Lord
This chart shows how the “feasts of the Lord,” which are described in detail in Leviticus 23, give a prophetic picture of Christ’s redemption of His people, Israel.
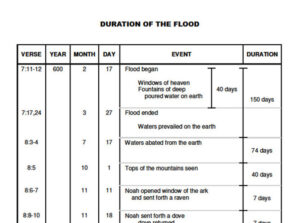
The Global Flood of Noah’s Day
This 2-page chart looks at the Scriptural evidence that the flood of Noah’s day was global. The second page shows the duration of the flood and the time it took for the ground to dry enough for Noah and his family to leave the ark.
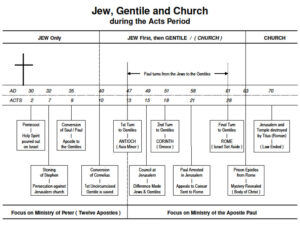
The Jew, Gentile, and Church During the Acts Period
This chart depicts the distinction between the Jew, the Gentile, and the Church (Body of Christ) during the Acts period.
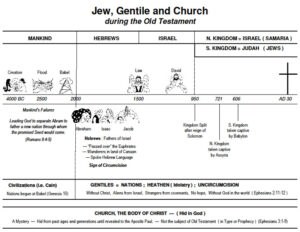
The Jew, Gentile, and Church in the Old Testament
This chart depicts the distinction between the Jew (Hebrew, Israel, Circumcision), the Gentile (Nations, Heathen, Uncircumcision), and the Church (Body of Christ) during the Old Testament period.
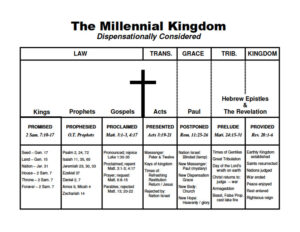
The Millennial Kingdom
This chart takes a dispensational look at the Millennial Kingdom as it has been revealed through the ages.
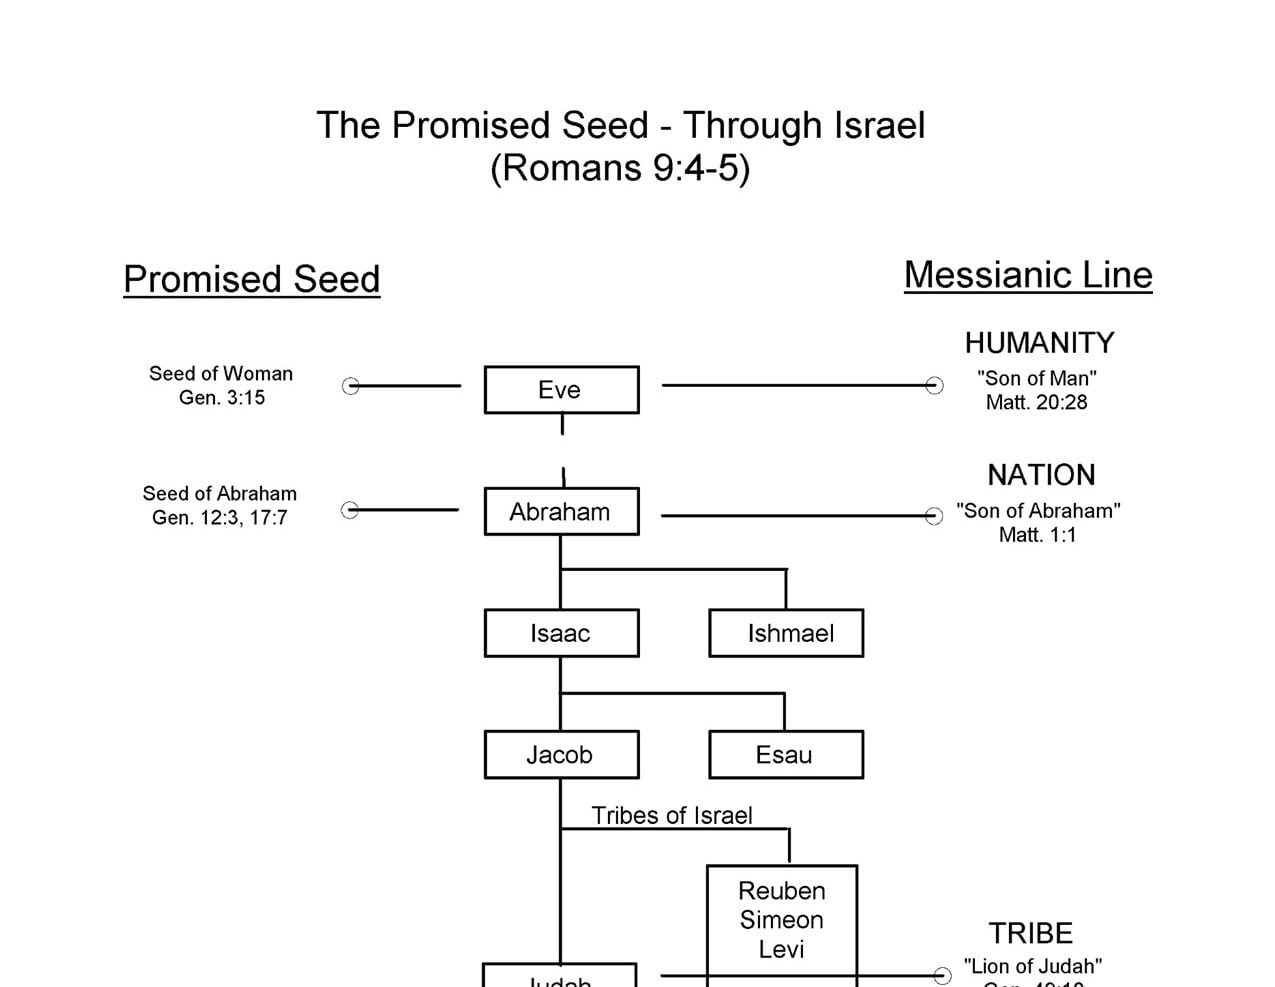
Promised Seed through Israel
This chart depicts the lineage of the promised Seed, whom God would send to save the world from sin and death, and how God would bring Him into this world through the nation of Israel.
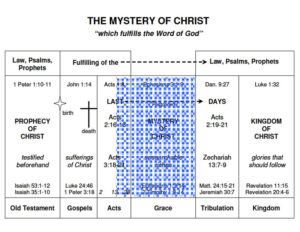
Prophecy vs Mystery
This 2-page chart shows how the mystery of Christ, given by revelation to the Apostle Paul, fulfills the Word of God and contrasts with that which was prophesied about Christ in the Old Testament Scriptures.
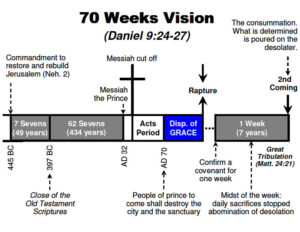
The Seventy Weeks Vision
This chart depicts the 70 weeks (“sevens”) vision Daniel received from the Lord to finish Israel’s transgression and bring in everlasting righteousness. The final “seven” (7 year period), commonly called the Tribulation Period, will occur just prior to Christ’s return to earth to establish His kingdom.
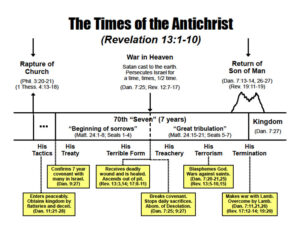
The Times of the Antichrist
This chart depicts key events surrounding the Antichrist and his time on earth (during the period between the rapture of the Church and the return of Christ to establish His kingdom).